Peter McColgan & Jonas Dorn
Peter McColgan from Roche spoke about the digital monitoring of cognitive and motor symptoms from the longitudinal study Generation HD1 in the tominersen trials. Peter described the digital monitoring platform employed during this therapeutic study (n=798 individuals). The platform was also used in the natural history study and open label extension study with tominersen. Peter presented again the data analysis of the Phase III tominersen study, where it was shown that a Q8w 120 mg arm of tominersen was deleterious in most clinical measures, and in ventricular volume. The Q16w 120 mg arm was better tolerated. These results led to the discontinuation of the study.
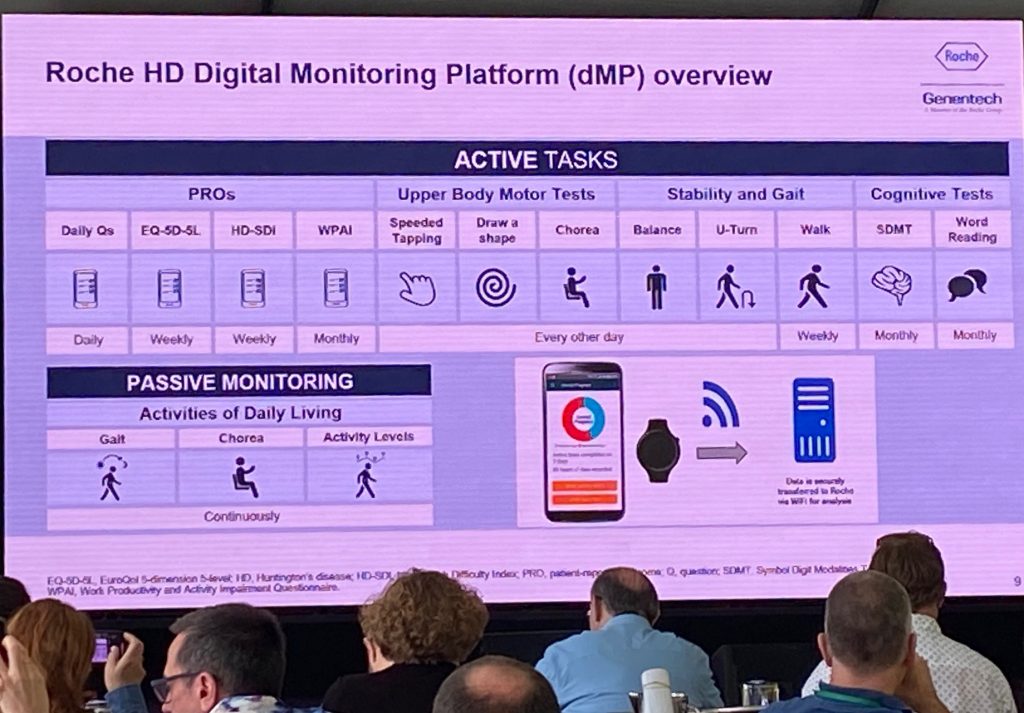
Next, Jonas spoke about the analysis of digital data, which is an exploratory platform to monitor symptoms at home via a mobile phone. Patients are asked to complete various tests/active tasks weekly or monthly and data are uploaded to the cloud, where it is accessible to study directors. Patients spent 30-60’/week for these active tests. In addition, passive monitoring took place during the study duration.
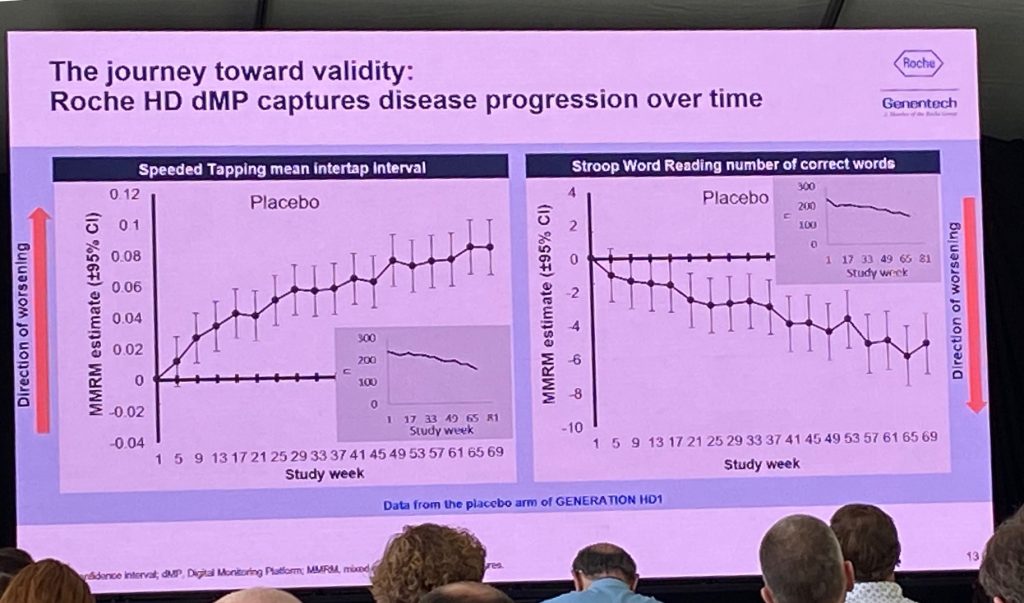
The digital platform showed good reliability and good test-retest reliability, showing differences across various HD groups and of comparable quality with in-clinic tests. The data analysis presented next are preliminary, but show that both speeded tapping and the Stroop word reading test show deterioration over time (image below). Some data was missing due to dropouts (some people stopped doing the tasks at the end of the study duration). It was then shown that the dropout was an issue, when comparing the placebo groups and also the Q8w, meaning that it is impossible to compare the placebo group to the other groups. The Roche team is trying to understand if there is an issue of adherence due to disease progression or due to some other factors. They are analyzing the data using various tests to see which ones are more likely to be used in future work – for example, there were issues with the draw-a-shape test but less so with speeded tapping. In spite of these issues, Roche considers that the collection of all that data was already a success from an operational perspective.
Sarah Tabrizi & Jeff Long
Sarah Tabrizi from the UCL HD center and Jeff Long from University of Iowa spoke about the HD-ISS integrated staging system (ISS) to better predict disease progression. They recommend abandoning the ‘age at motor diagnosis’ endpoint if we are to move into clinical studies conducted in earlier stage of the disease and to better stratify the patient population for disease modification and/or preventative trials. Sarah spoke about the importance of staging systems in clinical research and trials, following the example of the cancer field. This staging system enables internal and external valqtify of research studies, comparing across studies and obtain cumulative value of evidence. It also has implications for policies.

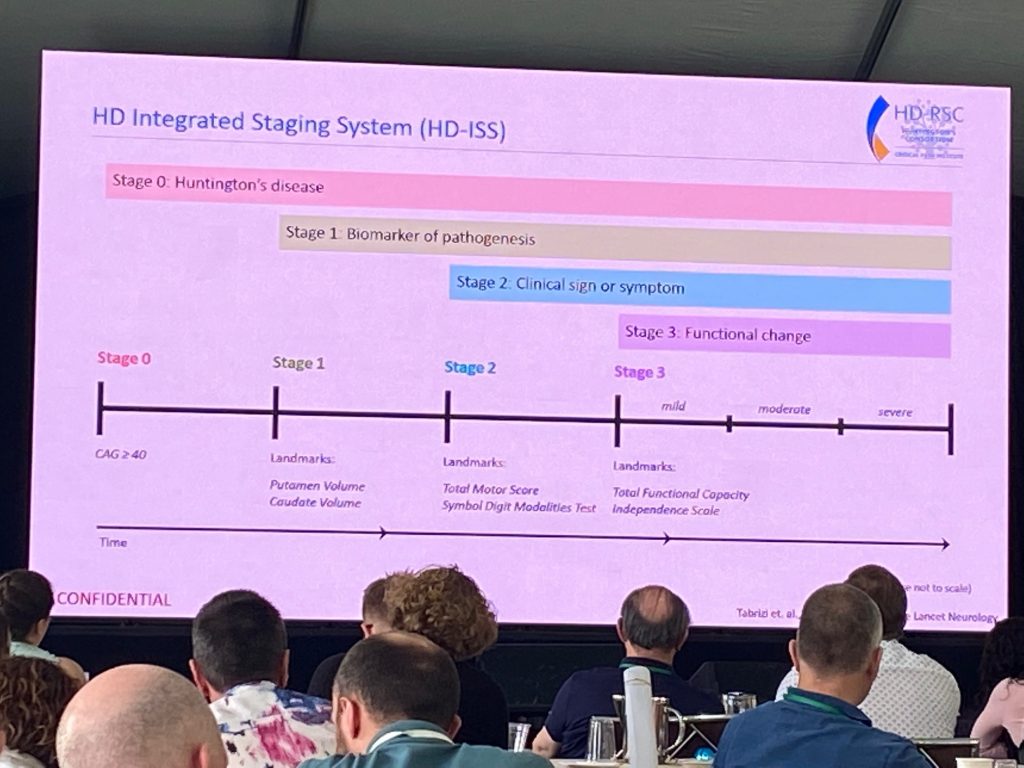
So why do we need a new staging system? Sarah explains that the age at motor diagnosis is too late an event in the progression, that many deficits arise earlier and are not accounted for. The HD-ISS is a staging system that aims to map progression from birth to death, using thousands of data points from longitudinal natural history studies. A new biological research definition of HD is presented, depending on CAG length (>40) or the presence of an intermediate CAG length (CAG36-39) and a change in a biomarker or clinical domain known to occur in HD. The staging system has 4 stages – stage 0 is no changes; stage 1 includes a change in a biomarker, and so on. In addition, a set of landmarks was identified for the transitions to various stages. For example, stage 1 landmark is caudate volume loss. This work is in press at The Lancet Neurology. Sarah explained that the impact of the HD-ISS provides a framework for advancing clinical trials, concluding input from patients and regulators alike.
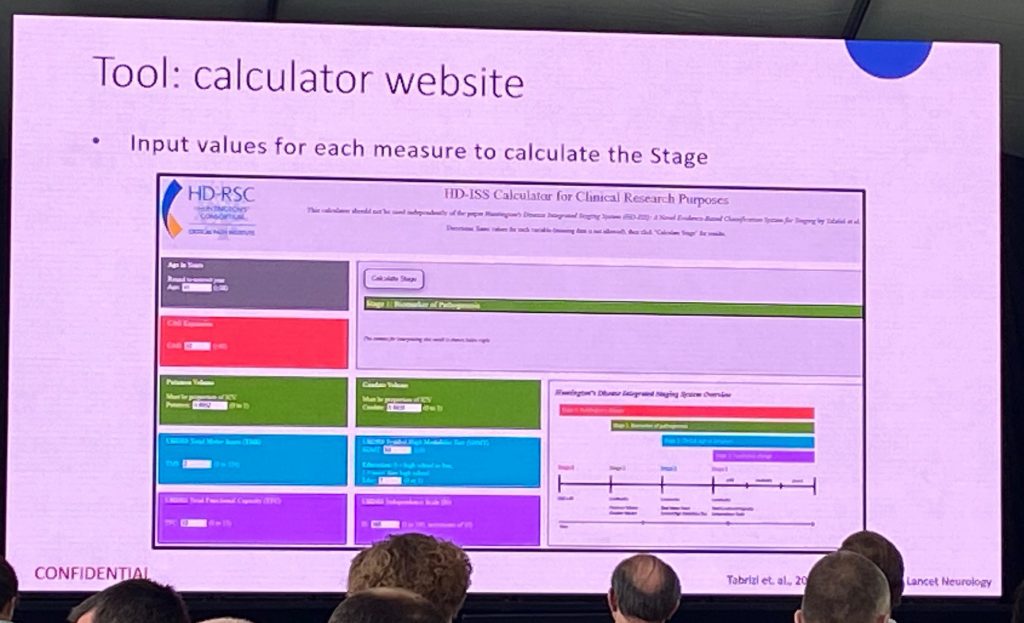
Next, Jeff Long presented the statistical principles behind enrollment criteria and how to classify individuals into the different stages based on landmarks and cut-off for inclusion (CAG-independent metrics). An online calculator has been developed, which everyone can access once the Lancet Neurology paper has been formally published. Jeff presented a few examples of how to use the calculator, based on volumetric data, and various clinical task scores (TMS, SDMT, educational level, TFC).
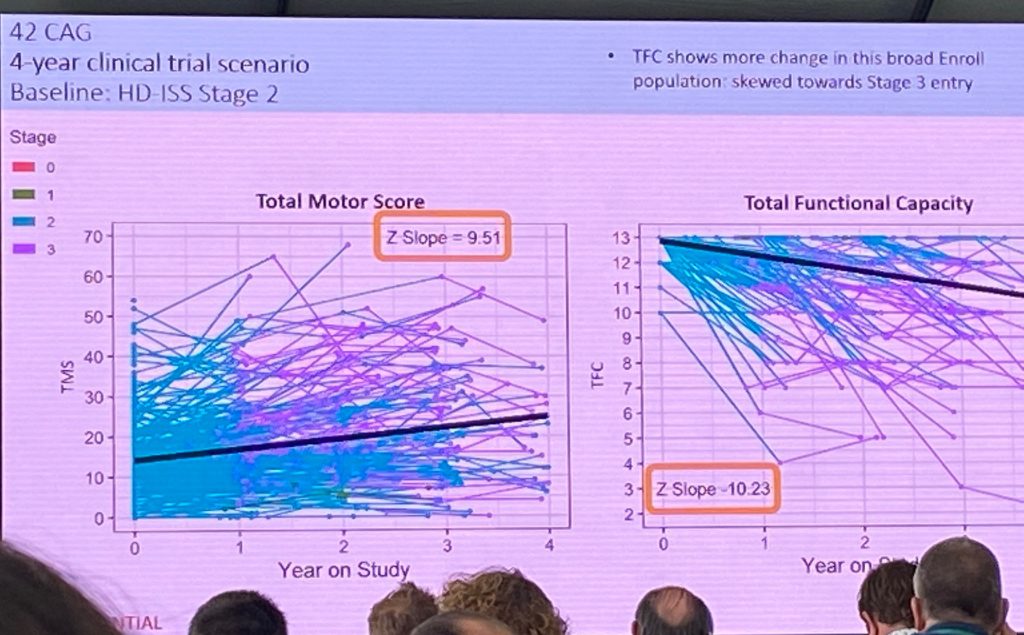
Next, Jeff described how available longitudinal data can be used to evaluate how the landmarks can be used to track HD progression. Available imaging data was analysis from >1200 individuals and >3200 visits, allowing repeated-measures analysis based on CAG and caudate volume. Volume can be included in trial participation along with clinical measures, for instance. Next, Jeff spoke about stage 2 and 3 variables, where we have >12000 measures in 40,000 visits, if we include the enroll-HD database. Due to the fact that enroll-HD does not include imaging endpoints, the enroll-HD database cannot be used to distinguish stage 0 from stage 1, as this is defined by an imaging change. Jeff presented data analyzed by CAG length in the TMS, defining the beginning of stage 2. The TFC scores were shown to exemplify the beginning of the stage 3.
Jeff finalized his comments with the topic of adding enrichment parameters to better classify trajectories within each stage, to better define a more refined stratification. Each stage at the moment is very long (6-10 years) and we need a more refined classification still, potentially including an analysis of their trajectories within a stage (say stage 2) as part of their enroll-HD monitoring. For example, inclusion of the PIN scores (Prognostic index for HD norm).
Jeff ended up with a 4-year clinical trial scenario for HD-ISS stage 2.